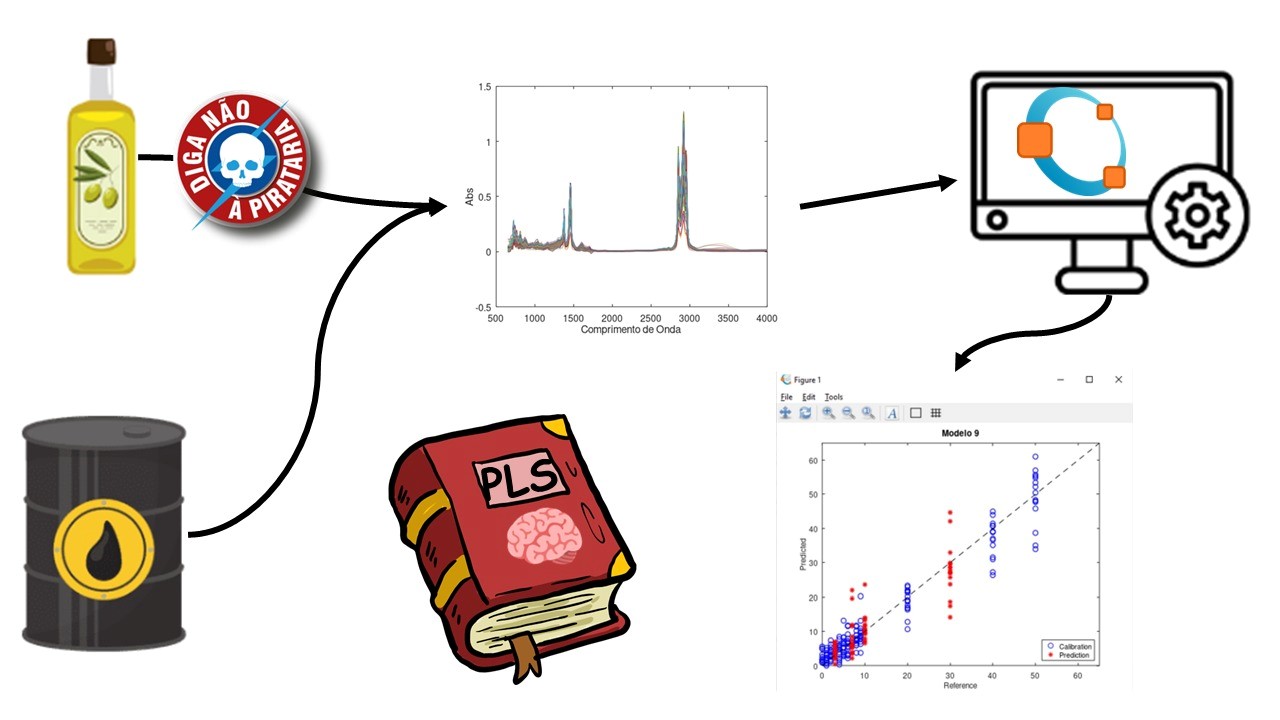
Tutorial for didactic application of chemometrics in free software – Part II: Partial Least Squares (PLS) regression on mid- and near-infrared data to determine adulterant content and physicochemical properties.
DOI:
https://doi.org/10.36524/ric.v10i4.2535Keywords:
Chemometrics, biodiesel, smartphone, photometrix, imagem, PLS, tutorial, Quimiometria; PLS; tutorial; Matlab; Octave., OctaveAbstract
The constant advance in technology, instrumentation, and the increase in data generation capacity has resulted in a new challenge for chemists: how to deal with complex, extensive, and multidimensional data sets. In this scenario, chemometrics emerged as a branch of chemistry specialized in the application of statistical and mathematical techniques for the analysis of multivariate analytical data, resulting in more precise and reliable scientific conclusions. As it is a relatively new area, there is still a lack of educational resources on the subject, and chemometric approaches are mostly confined to postgraduate courses. Therefore, this article provides a tutorial that can be used in various academic instances, with a focus on undergraduate education, to teach partial least squares regression (PLS). PLS is considered one of the most essential and common methods in chemometrics, and stands out for its ability to efficiently handle complex and highly correlated data sets, which is particularly important in regression analysis when there is significant multicollinearity among independent variables. In addition, PLS is known for its ease of use, making it a valuable tool for professionals seeking an effective approach to complex statistical modeling. We detail all the steps to create a complete PLS model, from installing the free GNU Octave software to producing the final figures. We also provide all the algorithms developed for data reading and processing. Finally, we interpret the obtained results so that the discussions and conclusions are easily understood by everyone.

Downloads
Published
Issue
Section
License
Copyright (c) 2024 Revista Ifes Ciência

This work is licensed under a Creative Commons Attribution-NonCommercial-NoDerivatives 4.0 International License.
Autores que publicam nesta revista concordam com os seguintes termos:
- Autores mantém os direitos autorais e concedem à revista o direito de primeira publicação, com o trabalho simultaneamente licenciado sob a Licença Creative Commons Attribution que permite o compartilhamento do trabalho com reconhecimento da autoria e publicação inicial nesta revista.
b. Autores têm permissão e são estimulados a publicar e distribuir seu trabalho online (ex.: em repositórios institucionais ou na sua página pessoal) a qualquer ponto antes ou durante o processo editorial, já que isso pode gerar alterações produtivas, bem como aumentar o impacto e a citação do trabalho publicado (Veja O Efeito do Acesso Livre).


